Install Grafana
View Metrics on the Grafana Dashboard
To visualize metrics from various sources, you can import and configure Grafana dashboards.
Step 1: Install Grafana using Helm
    helm repo add bitnami https://charts.bitnami.com/bitnami
    helm repo update bitnami
    helm install grafana bitnami/grafana -n grafana --create-namespace
Open the Grafana Dashboard
Follow these steps to access and set up the Grafana dashboard:
Step 1: Decode the Grafana Admin Password
kubectl get secret --namespace grafana grafana -o jsonpath="{.data.admin-password}" | base64 --decode ; echo
The login username is admin by default.
Step 2: Port-forward the Grafana Service
kubectl port-forward svc/grafana -n grafana 8080:3000
Once port-forwarded, open http://localhost:8080 in your browser.
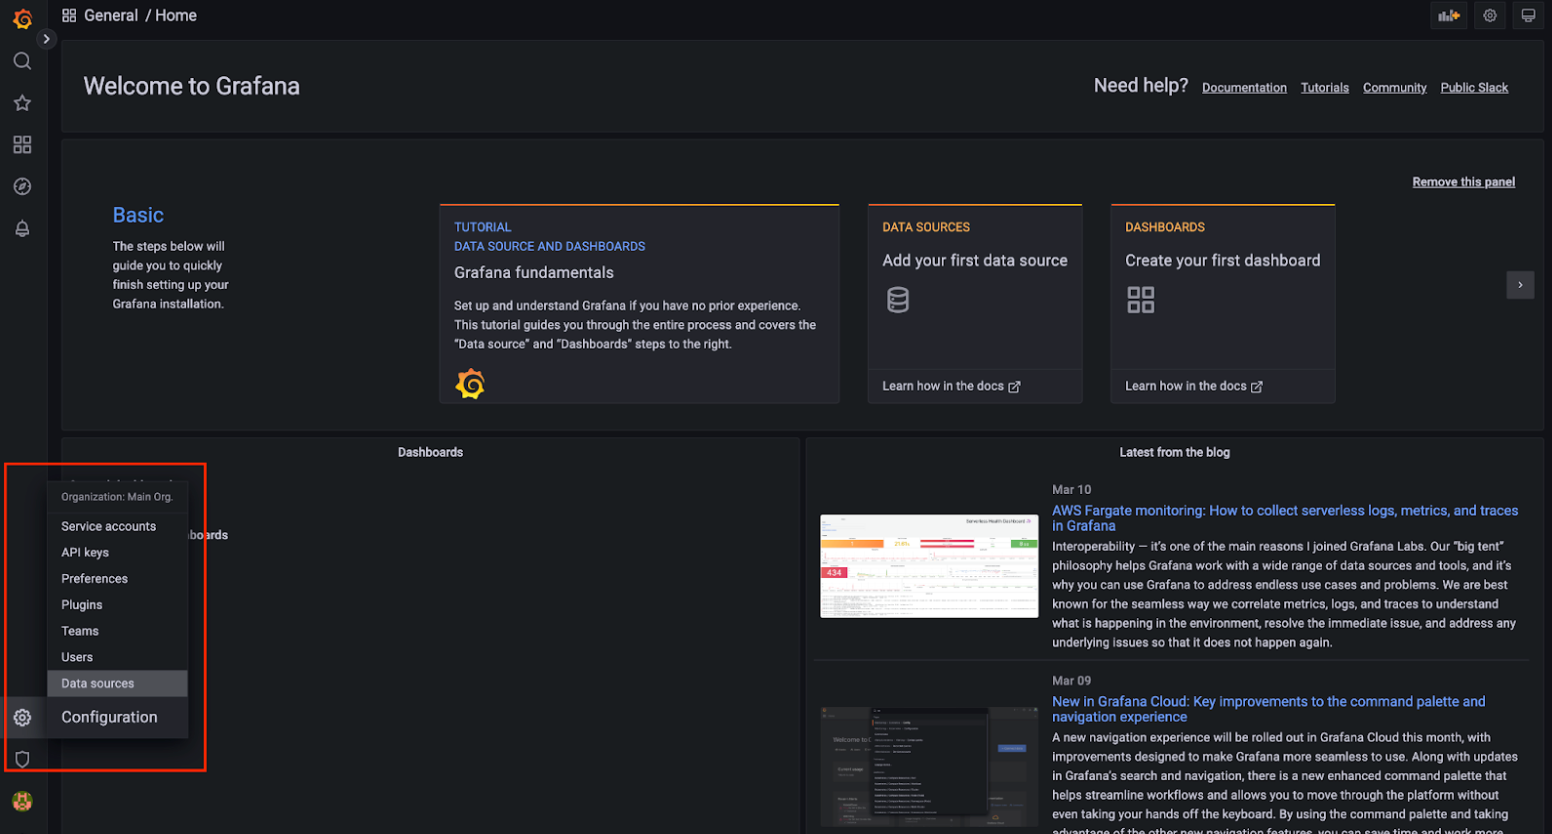
Step 3: Sign In and Add Prometheus as a Data Source
-
Go to Settings > Data Sources.
-
Click Add data source.
- Select Prometheus as the data source type.
Step 4: Configure Prometheus Connection
To connect to Prometheus deployed in the same Kubernetes cluster, use kubeDNS to define the Prometheus service address. The format for an incluster prometheus setup is:
http://<prometheus-service-name>.<namespace>.svc.cluster.local:<port>
For example:
http://my-release-kube-prometheus-prometheus.default.svc.cluster.local:9090/
Ensure the URL does not have trailing spaces or incorrect characters. Malformed URLs will cause the data source connection test to fail.
Step 5: Finalize Data Source Setup
-
Set Prometheus type and Prometheus version as applicable.
-
Click Save & test. You should see a success message confirming the connection.